In August was the cycling event La Vuelta Holanda. During three stages the cyclists toured the country from Utrecht, Breda and 's-Hertogenbosch. A big event with the necessary challenges around mobility and safety. Therefore, the organization of La Vuelta Holanda commissioned Argaleo to develop an innovative data dashboard. With real-time information, this dashboard supports the many stakeholders in the organization and management of this large-scale event.
The three stages that will be ridden during La Vuelta Holanda will pass through 34 municipalities and four provinces, with the start and finish on three different days in Utrecht, Breda and 's-Hertogenbosch. During these three days an action and safety center is set up in Utrecht from where all parties are informed and managed. Think of traffic controllers, security guards and emergency services. From the action center everything is arranged in terms of safety, mobility and crowd management. In short, this is a major operation that needs to be properly managed.
Real-time information
To have the right information available at the right time, the municipality of Utrecht, as project leader of La Vuelta Holanda, commissioned the company Argaleo to develop a dashboard based on their digital twin platform. In a digital 3D map of the Netherlands, all relevant data is linked. "From previous events, such as the start of the Tour de France, we drew up an integral information requirement of our wishes" says Ron Looy, project manager of La Vuelta Holanda. "Here it was important that we have the data available to us in real-time so we can make the right decisions in time." To have the same information available to everyone, the dashboard is shared with all professionals. So not only the mobility or safety experts of the three municipalities, but also for example safety regions and Rijkswaterstaat.

Route and location information
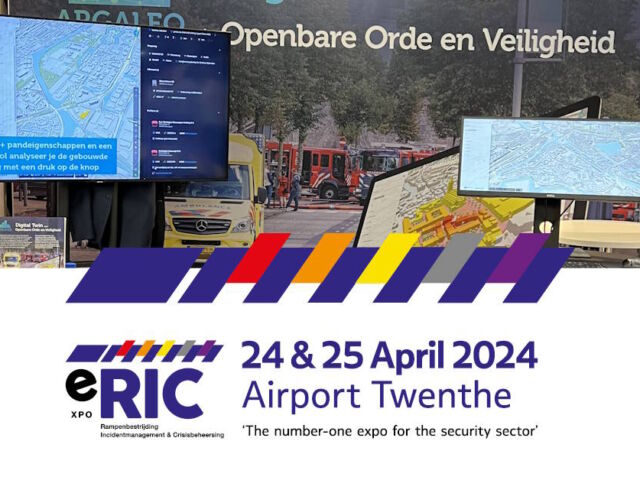
In the dashboard, various data sources are linked. Think of road maps, the routes of the stages and locations of the crowd barriers. And also real-time information. For example, you can see live in the dashboard where the peloton is located. In order to guide the public around the event in the right direction, live public transport and traffic data are linked and pressure measurements are taken at the event locations. "From other projects we have a lot of experience in the field of data-driven insights for public safety and mobility" says Jeroen Steenbakkers, owner of Argaleo. "These developments, and the fact that the municipality of Breda and Den Bosch already use our platform, ensured that we could quickly meet the information needs of the Vuelta organization." The various data brought together in the dashboard is a mix of public data sources, data from the municipality itself and data from professional suppliers such as SPOTinfo for the 3D maps and Infoplaza for the rainfall radar.

Real-time crowd information
Scaling up
Given the developments that Utrecht and Argaleo have achieved in the dashboard in a short time, discussions are being held to use the platform for other purposes and events after the Vuelta. Ron Looy: "During the Tour and in the Corona period we tested several separate data sources and applications. With this dashboard we think we can take the next step by having an integral and structural approach to providing information about mobility and safety in the future."
Want to know more about our digital twin solutions for public safety, mobility or crowd management? Get in touch with us.
more news
Subscribe now to the newsletter and stay informed of our digital twin innovations!