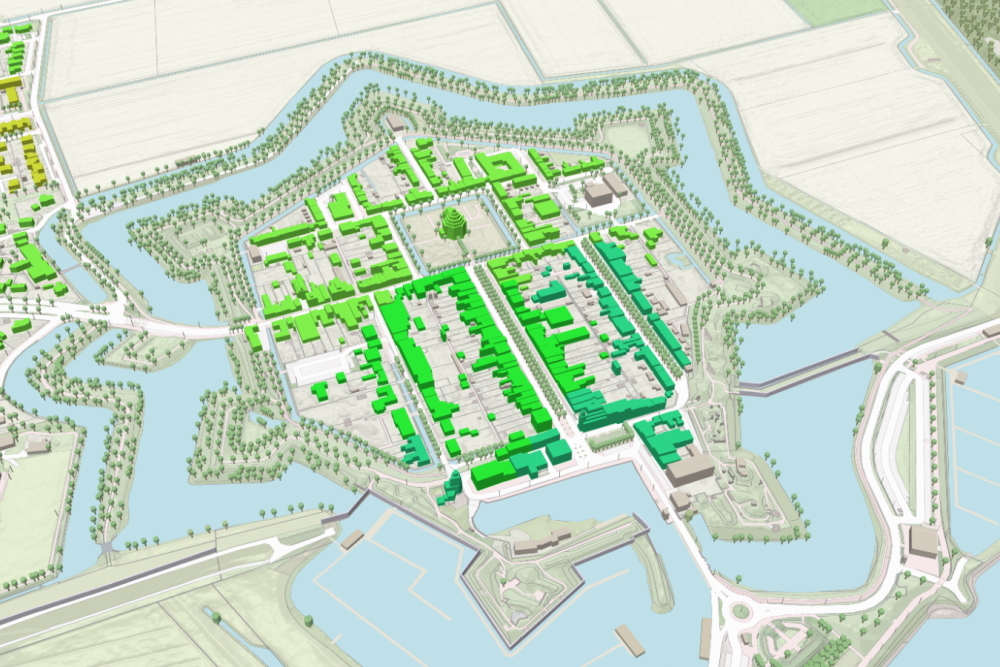
The liveability of all Dutch homes has been made clear in a 3D map. The quality of life is calculated by approximately one hundred indicators, such as the presence of greenery, number of primary schools and safety. This information is cleverly combined with data about buildings and therefore homes in the Environmental Server product. The Environment server shows the quality of life, varying from "very inadequate" to "excellent", in a 3D image of the whole of the Netherlands. This information supports policymakers in improving the living environment. But also real estate agents, for example, who need to value a house, can use this information.
The Leefbaarometer is a public dataset about the liveability in all neighbourhoods and districts of the Netherlands. The liveability is defined as the extent to which the living environment meets the conditions and needs we set for it. It reflects the current situation in the neighbourhood, but also the developments and backgrounds of the neighbourhood and surroundings. One hundred indicators, divided into five dimensions, are used to visualize liveability. This means that the Liveability Monitor forms the basis for policy preparation, adjustment and evaluation for various parties. The Liveability Monitor is updated every two years by the Ministry of the Interior.


Omgevingsserver is a data service with current location data in which more than one hundred datasets from a large number of national sources are brought together. In addition to the Liveable Gauge, information is available on, for example, building function, energy label, WOZ value but also Natura 2000 areas. The Environment server is used by information managers within both public and private organisations active in the management and development of the living environment. The addition of the Liveable Gauge to the Environment server enables this information manager to get an even better picture of this living environment.

